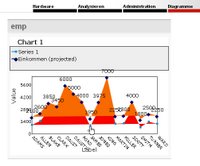
In order to create drill-down charts with Oracle Application Express you provide a SQL statement that will return the data to display a SVG chart's series. This SQL statement must be provided using this syntax:
SELECT link, label, value FROM...For example:
selectA simple chart might look like this:
'f?p=141:6:'||:app_session||'::::F141_P6_EMPNO:'||empno link,
ename,
sal
from emp

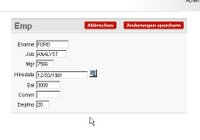
When clicking on the link you would want to see a detail page in
the same browser window:
 While this works well in Internet Explorer 6, Firefox 1.0.7 and Mozilla, what you see in Firefox 1.5 is:
This is due to a bug in Firefox 1.5 ( https://bugzilla.mozilla.org/show_bug.cgi?id=300868 )
. Unfortunately does Firefox ignore the target="_top" attribute for the xlink tag:
<a xlink:href="newdoc.html" target="_top">
The suggested workaround is :
xlink:href="javascript:window.top.location.href='newdoc.html'"
Using this fix to implement a workaround for Apex means changing a query like this:
SELECT *
FROM (SELECT   'f?p=&APP_ID.:14:' || :app_session || '::::P14_EMPNO:' || empno || ':' LINK
      , ename label, sal VALUE
   FROM HTMLDB_SAMPLES.EMP
  WHERE sal IS NOT NULL
ORDER BY ename)
to a query like this:
SELECT *
FROM (SELECT   'javascript:window.top.location.href=''f?p=&APP_ID.:14:' || :app_session
        || '::::P14_EMPNO:' || empno || ':''' LINK
      , ename label, sal VALUE
   FROM HTMLDB_SAMPLES.EMP
  WHERE sal IS NOT NULL
ORDER BY ename)
This works fine for all of the above mentioned browsers.
~Dietmar.
2 comments:
Hi
I begin with apex and get a problem with svg chart : I can not change the font size of the axis values but well the color ... ??? !!!
Could you help me ?
Hi anonymous,
I haven't used SVG charts in a while. It should be best to post directly in the forum: http://forums.oracle.com/forums/forum.jspa?forumID=137
You will definitely get some help, there.
Do you know about the new flash charts (starting with release 3.0)?
They are much better.
Regards,
~Dietmar.
Post a Comment